Factoring Pentest/Scan Results into Formal Risk Analysis
News flash: Those so-called “risk” labels/ratings included in pentest and vuln scan reports are NOT actually “risk” representations.
I was in attendance at the OWASP Summit 2011 a couple weeks back, and the topic of “risk metrics” and labels came up during one session. As a result, I led a break-out session on what risk really looks like in the macro sense, in accordance with formal methods, and where these various scan/test results really fit in. The session had great conversation and highlighted for me a need to expand risk analysis training to a broader audience.
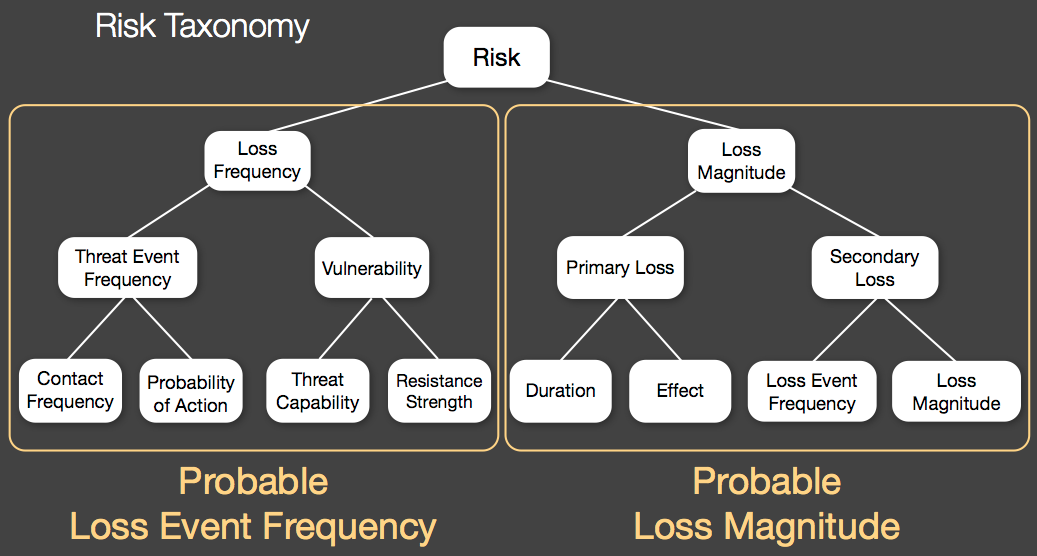
Below is a picture of the taxonomy of factors that make up a FAIR (Factor Analysis of Information Risk) risk analysis. Putting aside the discussion of how one generates the value ranges that go into each factor, let’s look at where pentest/scan results fall. Looking at the taxonomy below, note that there are two key halves: Loss Frequency and Loss Magnitude. As you peruse the factors that roll up to those halves, think about where your pentest/scan results might fit.
In order to properly estimate “risk” based on the results of a pentest or vuln scan, you need to understand the business impact in a number of structured scenarios. Simply understanding the Loss Frequency is not sufficient to estimate risk. However, that said, there is certainly valuable IF you process those findings accordingly. The main factor reflected by these test results will be “Resistance Strength,” which is to say that you will now have a better understanding of how much effort would be required to compromise your organization (given: compromise given enough time and resources is inevitable).
The next time you get a report from a vendor that talks about “risk,” please challenge their assertion. Ask them to explain how they estimated the financial impact of various weaknesses on your organization. Unless they interviewed your business management team to understand how a weakness could impact the business if exploited, then I submit that they’re not providing you with an actual risk rate. Instead, what you’re getting a snapshot reading of your Resistance Strength in a given context, as well as receiving some hints on what opposing Threat Capability might be. You’re still left needing to estimate the other factors under Loss Frequency, and you almost certainly need to fill in the blanks under Loss Magnitude (something that can be accomplished independently by developing loss tables for key systems, and then either providing those to 3rd parties performing the assessments, or combining them with the results on your own).
As an aside it’s worth noting that some 2nd generation “GRC” platforms are starting to integrate risk analysis capabilities like FAIR that can be leveraged to merge in scan/pentest results and to generate a reasonable risk analysis.

2 thoughts on “Factoring Pentest/Scan Results into Formal Risk Analysis”
I was at the OWASP summit break-out session you mentioned. What struck me was the different understandings of the term “risk” that the attendees had.
Comments are closed.